👋 my name is Logu & I am a Data Plumber
Modern Data Stack
& Cloud Tech


based in Melbourne, AU ❤️
Hi, I’m Logu Duraiswamy
a
Solution Designer.
Data Plumber.
Logical Thinker.
Proficiency in data modeling is essential for understanding how an organization generates and uses its data, and how different data points connect, Competence in presenting data insights through visual representations to aid in decision-making
Home Workshop
Innovating Sustainability: From Solar-Powered Smart Displays to the Modern Data Stack and Beyond
A Fusion of Eco-Friendly Home Automation, Data-Driven Insights, and Automated Weather Forecasts
In the dynamic landscape of technology, this blog unveils a narrative that seamlessly intertwines three captivating stories: the transformation of broken laptops into solar-powered smart displays for sustainable home automation, the exploration of the modern data stack’s capabilities in handling real-world data, and the integration of automated weather forecasts using OpenWeather, Apache Airflow, Apache Kafka, and Telegram. Brace yourself for a comprehensive journey that fuses innovation, sustainability, data-driven insights, and automated weather updates.
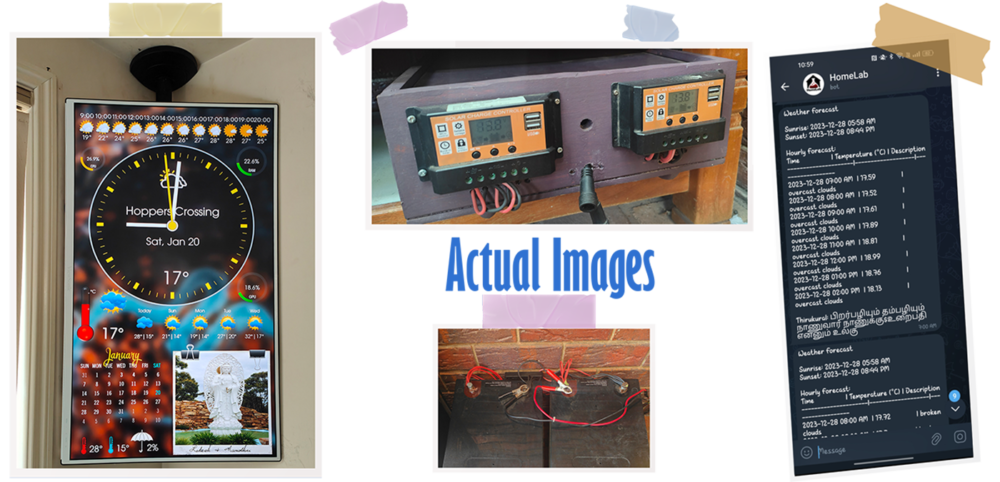
Repurposing Broken Laptops for Sustainable Home Automation
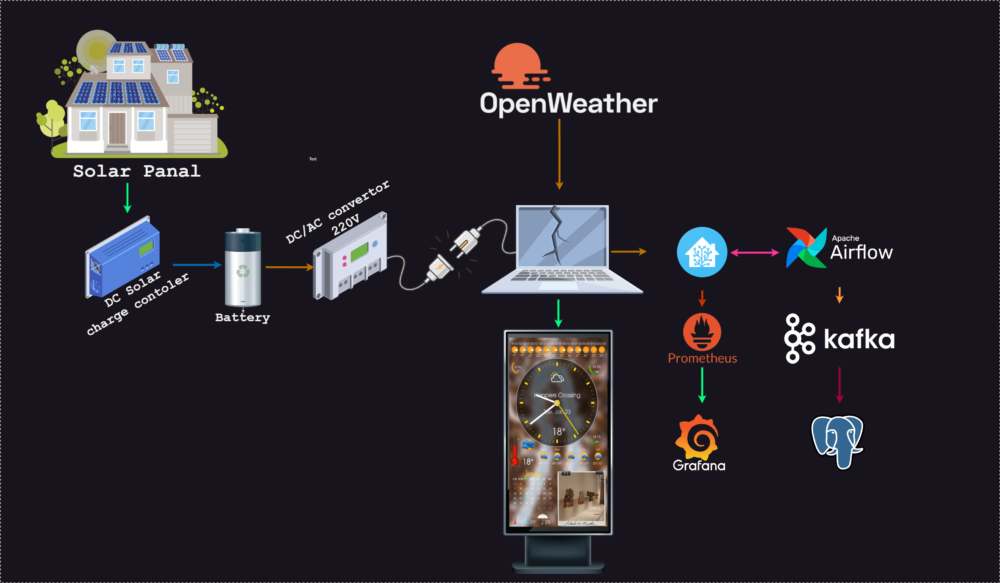
The quest for sustainable living takes a bold step as we delve into repurposing broken laptops into solar-powered smart displays. This initiative goes beyond technical feats, showcasing the potential of eco-friendly innovation. The blog guides readers through the step-by-step process, from installing Home Assistant and transforming a discarded laptop into a smart display to augmenting its functionality with solar energy and battery storage. Witness the resurrection of outdated technology, creating an environmentally conscious and technologically advanced setup for the home.
More detail
The Modern Data Stack: Empowering Data-Driven Decisions
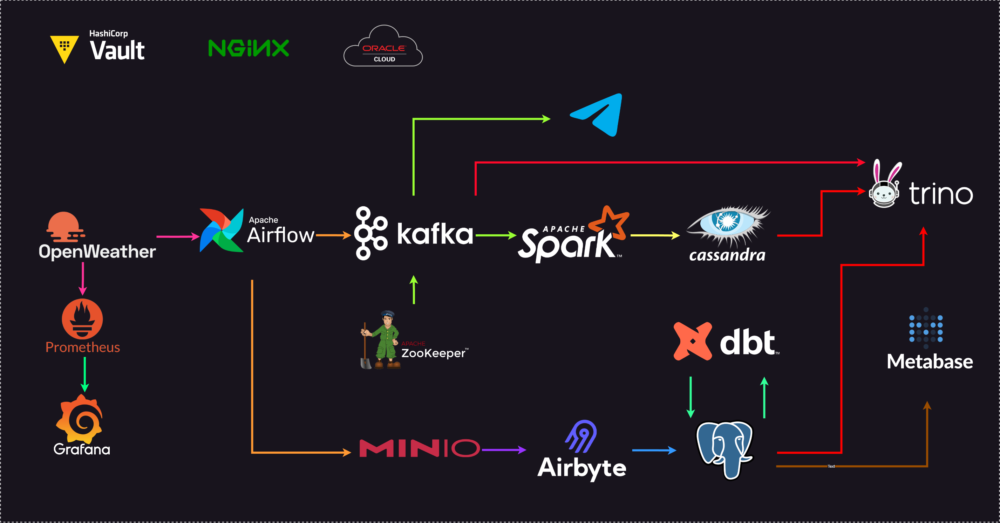
As we embark on this sustainable journey, the spotlight shifts to the modern data stack—an ensemble of integrated tools and processes designed to redefine how organizations handle data. This section introduces participants to the practical aspects of ELT/ETL processes and data modeling, using weather data sourced from the OpenWeather API as a tangible example.
More detail
Automated Weather Forecasts with OpenWeather, Apache Airflow, Apache Kafka, and Telegram
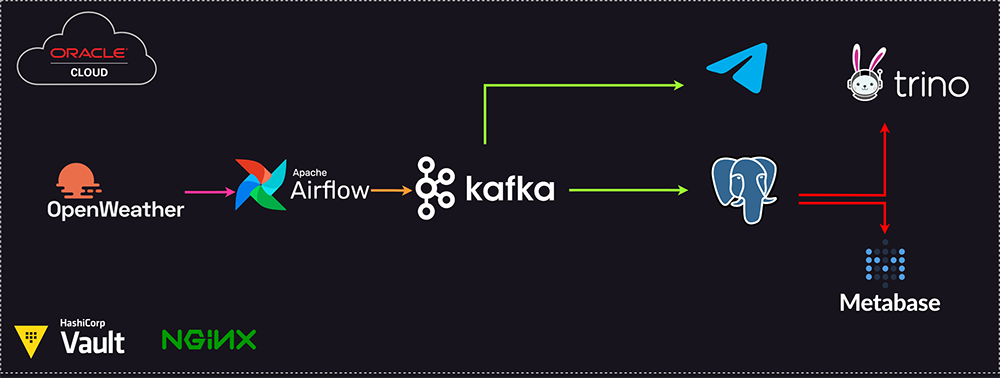
Taking innovation a step further, we introduce the integration of OpenWeather, Apache Airflow, Apache Kafka, and Telegram for automated weather forecasts. Participants engage in a home workshop, leveraging the modern data stack to automate the delivery of daily weather forecasts. The workflow, orchestrated by Apache Airflow, collects weather data from OpenWeather, processes it, and uses Apache Kafka to facilitate seamless communication. Telegram delivers daily forecasts every four hours, from 6 AM to 9 PM, accompanied by a random proverb Thirukural verse for a touch of inspiration.
More detail
Bridging Two Worlds: Sustainability, Data Integration, and Automated Forecasting
This synthesis of sustainable home automation, the modern data stack, and automated weather forecasting offers participants a holistic understanding of integrated data processing. The blog underscores the potential of the modern data stack in handling diverse data sources and its role in driving data-informed decision-making. The automated weather forecasts serve as a practical application, showcasing the power of technology in delivering real-time, actionable insights seamlessly.
Conclusion: Harmonizing Sustainability, Data Insights, and Automation
In conclusion, this blog serves as a harmonious convergence of sustainable home automation, the modern data stack, and automated weather forecasting. Through the innovative repurposing of broken laptops, exploration of data processing tools, and integration of automated workflows, participants gain not only technical insights but also a profound appreciation for the symbiotic relationship between innovation, sustainability, data-driven decision-making, and automated processes. It’s a journey that invites individuals to embrace a future where eco-friendly practices, cutting-edge technology, and automated insights coalesce to shape a smarter, greener world.
Home Workshop

Orchestrating Real-Time Insights: Weather Data Extraction with The Modern Data Stack
Introduction:
In today’s data-driven world, the ability to harness real-time data is crucial for making informed decisions. In this home lab workshop, we aim to extract real-time weather data from Pondicherry and Melbourne every 10 minutes. To accomplish this, we’ll leverage a modern data stack comprising various cutting-edge tools and technologies. This hands-on project will provide practical insights into modern data architecture and its components.
High-level architecture diagram:
Tools in Our Modern Data Stack:
-
Apache Airflow:
- Purpose: Workflow automation and scheduling.
- Role: Orchestrating the entire data pipeline, ensuring seamless execution of tasks.
-
Airbyte:
- Purpose: Data integration and replication.
- Role: Facilitating the extraction of weather data from diverse sources and ensuring its uniformity.
-
PostgresDB:
- Purpose: Relational database management.
- Role: Storing structured weather data for easy retrieval and analysis.
-
Cassandra DB:
- Purpose: NoSQL database management.
- Role: Handling large volumes of data with high write and read throughput.
-
Vault:
- Purpose: Secret management and data protection.
- Role: Safeguarding sensitive information such as API keys and credentials.
-
DBT (Data Build Tool):
- Purpose: Transforming and modeling data.
- Role: Enabling analysts to work with structured, clean data for insights.
-
Kafka:
- Purpose: Distributed event streaming platform.
- Role: Facilitating real-time data streaming between different components of the stack.
-
Spark Structural Streaming:
- Purpose: Real-time data processing.
- Role: Performing complex computations on streaming data.
-
Grafana:
- Purpose: Data visualization and monitoring.
- Role: Creating dashboards to visualize weather trends and system performance.
-
Metabase:
- Purpose: Business intelligence and analytics.
- Role: Empowering users to explore and analyze data through a user-friendly interface.
-
Nginx:
- Purpose: Web server and reverse proxy server.
- Role: Securing and optimizing data transmission between components.
-
Prometheus:
- Purpose: Monitoring and alerting toolkit.
- Role: Keeping track of system metrics and ensuring reliability.
-
Telegram:
- Purpose: Communication and alerting.
- Role: Sending notifications and alerts based on predefined conditions.
-
Minio:
- Purpose: Object storage.
- Role: Storing unstructured data such as raw weather data.
-
Trino:
- Purpose: Distributed SQL query engine.
- Role: Enabling users to query and analyze data stored in different databases seamlessly.

Simplifying Secure Connections: Setting Up Nginx Reverse Proxy with Certbot for Let’s Encrypt SSL Certificates
High-level architecture diagram:
Prerequisites:
- Nginx Installed: If Nginx isn’t already installed, you can install it using your package manager. For example, on Ubuntu:
sudo apt update sudo apt install nginx
- Domain Pointing to Your Server: Ensure your domain is correctly pointed to your server’s IP address.
- Certbot Installed: Install Certbot on your server:
sudo apt-get update sudo apt-get install certbot python3-certbot-nginx
Configuring Nginx Reverse Proxy for Each Service:
For each service, create a separate Nginx configuration file in /etc/nginx/sites-available/
:
sudo nano /etc/nginx/sites-available/SERVICE_NAME
Replace SERVICE_NAME
with the actual service name and BACKEND_ADDRESS
with the address of your backend server.
Example for Airbyte (airbyte.logu.au
):
server {
listen 80;
server_name airbyte.logu.au;
location / {
proxy_pass http://BACKEND_ADDRESS;
proxy_set_header Host $host;
proxy_set_header X-Real-IP $remote_addr;
proxy_set_header X-Forwarded-For $proxy_add_x_forwarded_for;
proxy_set_header X-Forwarded-Proto $scheme;
}
location ~ /.well-known/acme-challenge {
allow all;
root /var/www/html;
}
}
Repeat this step for each service, customizing the server_name
and proxy_pass
accordingly.
Enabling Nginx Configuration:
Create symbolic links to enable the Nginx configurations:
sudo ln -s /etc/nginx/sites-available/SERVICE_NAME /etc/nginx/sites-enabled/
Testing and Restarting Nginx:
Ensure there are no syntax errors:
sudo nginx -t
If no errors are reported, restart Nginx:
sudo service nginx restart
Obtaining Let’s Encrypt SSL Certificates:
Run Certbot for each service:
sudo certbot --nginx -d SERVICE_NAME
Follow the prompts to configure SSL and automatically update Nginx configurations.
Testing Renewal and Updating DNS Records:
Test the renewal process for each service:
sudo certbot renew --dry-run
Ensure DNS records for each service point to your server’s IP address.
Verifying HTTPS Access:
Access each service via HTTPS (e.g., https://airbyte.logu.au
). Ensure the SSL padlock icon appears in the browser.
Repeat these steps for each service, replacing SERVICE_NAME
with the respective service’s domain.
By following these steps, you’ll have a secure setup with Nginx acting as a reverse proxy and Let’s Encrypt providing SSL certificates for each service. Adjust configurations as needed based on specific service requirements. Stay secure and enjoy your enhanced web services!

Automating Weather Forecast Extraction and Proverb Delivery with Airflow, PostgreSQL, Kafka, and Telegram
In today’s fast-paced world, having timely and accurate information is crucial. Imagine a scenario where you can receive the next 5-hour weather forecast along with a random proverb from Thirukkural, all delivered to your Telegram every few hours. This blog post walks you through a project that achieves just that, leveraging the power of Airflow, PostgreSQL, Kafka, and Telegram.
High-level architecture diagram:

Phase 1: Data Extraction
1.1 OpenWeather API Integration
Begin the automation journey by obtaining an API key from OpenWeather. Craft a script to pull the next 5-hour weather forecast and store the data as a JSON file. This serves as the foundation for the entire project.
1.2 Thirukkural Proverbs in PostgreSQL
Populate a PostgreSQL database with random proverbs from Thirukkural. Each proverb should be associated with a unique identifier for efficient retrieval during the automation process.
Phase 2: Airflow Orchestration
2.1 Airflow DAG Configuration
Set up an Airflow DAG to serve as the conductor for the entire automation symphony. Schedule the DAG to execute at 9 AM, 12 PM, 3 PM, and 6 PM, ensuring timely and periodic data extraction.
2.2 Task Execution – OpenWeather and Thirukkural
Within the DAG, configure tasks to execute the OpenWeather API script and fetch a random proverb from the PostgreSQL database. Leverage Airflow’s task dependencies to ensure a sequential and error-resilient execution.
2.3 Kafka Integration
Upon successful extraction, dispatch the obtained JSON data to a Kafka topic named “Forecast.” This establishes a communication bridge between the data extraction phase and subsequent processing.
Phase 3: Telegram Delivery
3.1 Airflow-Kafka-Telegram Integration
Configure Airflow to consume the JSON messages from the “Forecast” Kafka topic. Implement a task that sends the extracted data as a message to a designated Telegram channel. This step ensures a user-friendly and accessible delivery mechanism.
3.2 Benefits and Conclusion
Reflect on the benefits of the automated system, emphasizing the timely and accurate delivery of weather forecasts and Thirukkural proverbs. Discuss how this project seamlessly integrates various technologies, providing a practical example of automation and orchestration in a real-world scenario.
Implementation Insights
4.1 Scalability and Maintenance
- Discuss the scalability of the system for potential future enhancements.
- Highlight maintenance considerations, such as versioning for API changes and database updates.
4.2 Error Handling and Logging
- Detail the error handling mechanisms in place within Airflow.
- Emphasize the importance of comprehensive logging for debugging and monitoring.
4.3 User Interaction
- If applicable, discuss potential ways to allow user interaction with the system, such as customizing the time of forecast delivery.
In conclusion, this project exemplifies the power of automation in delivering valuable information seamlessly. By orchestrating the extraction, processing, and delivery phases, the system ensures a reliable and timely stream of weather forecasts and cultural wisdom to end-users through the synergy of Airflow, PostgreSQL, Kafka, and Telegram.

Unlocking Insights: Visualizing and Monitoring Oracle Cloud VM Hosted Tools with Grafana
In the dynamic landscape of cloud computing, monitoring and visualizing the health and performance of your hosted tools are paramount. This blog post takes you through the journey of setting up Grafana dashboards to monitor various tools hosted on an Oracle Cloud VM. Specifically, we’ll be diving into three Grafana dashboards:
High-level architecture diagram:

Dashboard 1: Docker Host
1.1 Setting the Stage
Begin by visualizing and monitoring the Oracle Cloud VM itself. Grafana Dashboard 1 focuses on essential metrics such as CPU usage, memory utilization, disk I/O, and network traffic. This provides a bird’s-eye view of the overall health and performance of your hosting environment.
Dashboard 2: Docker Containers
2.1 Tools Overview
In Dashboard 2, we delve into the Docker containers running on the VM, each representing a critical tool in your infrastructure. These include Apache Airflow, Airbyte, PostgresDB, Cassandra DB, Vault, DBT, Kafka, Spark Structural Streaming, Grafana, Metabase, Nginx, Prometheus, Telegram, Minio, and Trino.
2.2 Metrics and Health Checks
For each container, visualize key metrics such as CPU and memory usage, network statistics, and any custom health checks specific to the tool. A comprehensive overview of your entire toolset allows for quick identification of bottlenecks or issues.
Dashboard 3: Prometheus Exporter
3.1 Domain Monitoring
Dashboard 3 focuses on monitoring various domains associated with your tools. From logu.au
to specific tool instances like airbyte.logu.au
and kafka.logu.au
, track metrics related to performance, errors, and system health.
3.2 Leveraging Prometheus Exporter
Integrate Prometheus exporter metrics into Grafana to ensure a unified monitoring experience. Explore Prometheus metrics for Spark, Nginx, Minio, Trino, and more. This dashboard acts as a centralized hub for all your Prometheus-exported metrics.
Implementation and Configuration Tips
4.1 Data Sources
- Integrate Grafana with Prometheus for metric collection.
- Ensure proper configuration of data sources for Docker and Oracle Cloud VM metrics.
4.2 Visualization Best Practices
- Utilize Grafana’s rich visualization options to create intuitive and informative graphs.
- Leverage templating for dynamic dashboard elements, facilitating easy navigation.
4.3 Alerts and Notifications
- Implement Grafana alerts for critical metrics to receive timely notifications.
- Configure notification channels such as email or messaging platforms like Telegram.
Conclusion
By implementing these Grafana dashboards, you’re not only visualizing the current state of your Oracle Cloud VM and hosted tools but also proactively monitoring for potential issues. This approach ensures that you have actionable insights into the performance, health, and status of your critical infrastructure, empowering you to make informed decisions and maintain a robust and efficient system.

From Weather Data to Cassandra: A Data Pipeline Journey with Airflow, Kafka, Spark, and Trino
In the era of data-driven insights, automating the extraction, transformation, and loading (ETL) of weather data is essential. This blog takes you through a project that utilizes Apache Airflow, Kafka, Apache Spark Structural Streaming, Cassandra DB, and Trino to seamlessly extract, process, and query weather data for Pondicherry and Melbourne in intervals of every 10 minutes.
High-level architecture diagram:
Phase 1: Data Extraction with Airflow
1.1 OpenWeather API Integration
Start by integrating the OpenWeather API with Airflow to fetch weather data for Pondicherry and Melbourne. The JSON structure of the data is as follows:
{
"id": "556c12f62222411b8fb1a9363c39087b",
"city": "Pondicherry",
"current_date": "2023-12-31T11:39:56.709790",
"timezone": "b'Asia/Kolkata' b'IST'",
"timezone_difference_to_gmt0": "19800 s",
"current_time": 1704022200,
"coordinates": "12.0°E 79.875°N",
"elevation": "3.0 m asl",
"current_temperature_2m": 27,
"current_relative_humidity_2m": 68,
"current_apparent_temperature": 28.756290435791016,
"current_is_day": 1,
"current_precipitation": 0,
"current_rain": 0,
"current_showers": 0,
"current_snowfall": 0,
"current_weather_code": 1,
"current_cloud_cover": 42,
"current_pressure_msl": 1011.4000244140625,
"current_surface_pressure": 1011.0546875,
"current_wind_speed_10m": 16.485485076904297,
"current_wind_direction_10m": 58.39254379272461,
"current_wind_gusts_10m": 34.91999816894531
}
1.2 Airflow Scheduling
Set up an Airflow DAG to schedule the data extraction task every 10 minutes. This ensures a regular and timely flow of weather data into the pipeline.
Phase 2: Streaming to Kafka and Spark
2.1 Kafka Integration
Integrate Kafka into the workflow to act as the intermediary for streaming data between Airflow and Spark. Configure topics for Pondicherry and Melbourne, allowing for organized data flow.
2.2 Spark Structural Streaming
Leverage Apache Spark Structural Streaming to process the JSON data from Kafka in real-time. Implement Spark jobs to handle the incoming weather data and perform any necessary transformations.
Phase 3: Loading into Cassandra DB
3.1 Cassandra Schema Design
Design a Cassandra database schema to accommodate the weather data for both Pondicherry and Melbourne. Consider factors such as partitioning and clustering to optimize queries.
3.2 Cassandra Data Loading
Use Spark to load the processed weather data into Cassandra. Implement a robust mechanism to handle updates and inserts efficiently.
Phase 4: Querying with Trino
4.1 Trino Configuration
Set up Trino (formerly PrestoSQL) to act as the query engine for the data stored in Cassandra and Kafka. Configure connectors for both systems to enable seamless querying.
4.2 Query Examples
Provide examples of Trino queries that showcase the power of querying weather data from both Cassandra and Kafka. Highlight the flexibility and speed of Trino for data exploration.
Conclusion: A Seamless Data Journey
In conclusion, this project demonstrates the power of automation and integration in the data processing realm. By orchestrating data extraction with Airflow, streaming with Kafka and Spark, loading into Cassandra, and querying with Trino, we’ve created a robust and scalable pipeline. This not only ensures a continuous flow of weather data but also enables efficient querying and analysis, unlocking valuable insights for various applications.

Weather Insights Unleashed: A Daily Data Odyssey with ELT and Airflow, Minio, Airbyte, DBT, Metabase, and Trino
In the era of data-driven decision-making, extracting, transforming, and analyzing weather data can unlock valuable insights. This blog chronicles a comprehensive project that employs Apache Airflow, Minio (S3), Airbyte, DBT, Metabase, and Trino to seamlessly orchestrate the daily journey of weather data for Pondicherry and Melbourne, from extraction to analysis.
High-level architecture diagram:
Phase 1: CSV Extraction and Minio Storage
1.1 Data Transformation to CSV
Building upon the existing project, extend the data transformation process to export the weather information for Pondicherry and Melbourne into CSV format.
1.2 Minio (S3) Storage
Integrate Minio, an open-source object storage solution compatible with Amazon S3, into the workflow. Configure Minio to create a bucket and store the extracted CSV files securely.
Phase 2: Loading to Postgres DB with Airbyte
2.1 Airbyte Integration
Leverage Airbyte, an open-source data integration platform, to seamlessly move data from Minio to Postgres DB. Configure Airbyte connections for Minio as the source and Postgres as the destination.
2.2 Airflow Orchestration
Extend the Airflow DAG to orchestrate the entire process. This includes triggering the CSV extraction, storing it in Minio, and orchestrating the data transfer from Minio to Postgres using Airbyte.
Phase 3: ELT with DBT for Daily Analysis
3.1 DBT Modeling
Use DBT, a popular data modeling tool, to define models that transform the raw weather data into meaningful aggregates. Write SQL transformations to calculate average weather metrics for Pondicherry and Melbourne.
3.2 Automated DBT Runs with Airflow
Integrate DBT into the Airflow workflow. Schedule and execute DBT runs every day at 1 AM after each data load, ensuring that the analysis is always up-to-date.
Phase 4: Visualizing Insights with Metabase
4.1 Metabase Integration
Connect Metabase, an open-source business intelligence tool, to the Postgres DB where the transformed weather data resides. Configure Metabase to visualize the data and create dashboards.
4.2 Airflow-Metabase Integration
Extend the Airflow DAG to automate the refreshing of Metabase dashboards every day after the DBT run, ensuring that stakeholders have access to the latest weather insights.
Phase 5: Seamless Querying with Trino
5.1 Trino Configuration
Configure Trino to act as the query engine, allowing users to seamlessly query the transformed weather data stored in Postgres and explore insights.
5.2 Unifying the Ecosystem
Highlight the synergy achieved by integrating Airflow, Minio, Airbyte, DBT, Metabase, and Trino, creating a cohesive ecosystem for daily weather data management and analysis.
Conclusion: Empowering Daily Data-Driven Decisions
In conclusion, this project exemplifies the power of integrating various tools to create a streamlined pipeline for daily weather data extraction, loading, transformation with DBT, analysis, and visualization. By orchestrating this process with Apache Airflow, each component seamlessly contributes to the daily journey, ultimately empowering users to make informed, data-driven decisions based on the average weather insights for Pondicherry and Melbourne. The ELT process using DBT ensures that data transformations are done efficiently and consistently, adding a robust layer to the data pipeline. The system’s automation ensures that stakeholders wake up every day to the freshest weather insights at 1 AM.